Jason Summers

Automotive Operations & Technical Analyst

I specialize in understanding how automotive operations behave in the real world — across workflows, performance, repair decisions, and cost. With 20+ years diagnosing complex vehicle issues and leading technicians, I now focus on analyzing operational data, identifying root causes, and turning noisy metrics into clear, actionable insight.

My work sits at the intersection of technical judgment and analysis. I help teams evaluate repair legitimacy, improve process consistency, and make better decisions by combining hands-on operational experience with structured reporting, SQL, Excel, and dashboards.

Root cause investigation & operational diagnosticsRepair, cost, and process analysisSQL, Excel, Python & decision-support dashboards

About Me

Jason Summers

Hey, I'm Jason. I'm an automotive operations and technical analyst with 20+ years of experience diagnosing complex problems, coaching technicians, and supporting repair decisions in high-volume service environments. Throughout my career, I've been drawn to understanding patterns, identifying root causes, and making sense of operational data behind real-world decisions.

As a Technician Production Manager, I oversee technician workflow, approve repairs, and manage throughput while balancing cost, quality, and cycle time. I work closely with service advisors, operations leaders, and cross-functional teams to ensure repairs are appropriate, well-documented, and aligned with operational standards, while continuously looking for trends and opportunities to improve how the operation runs.

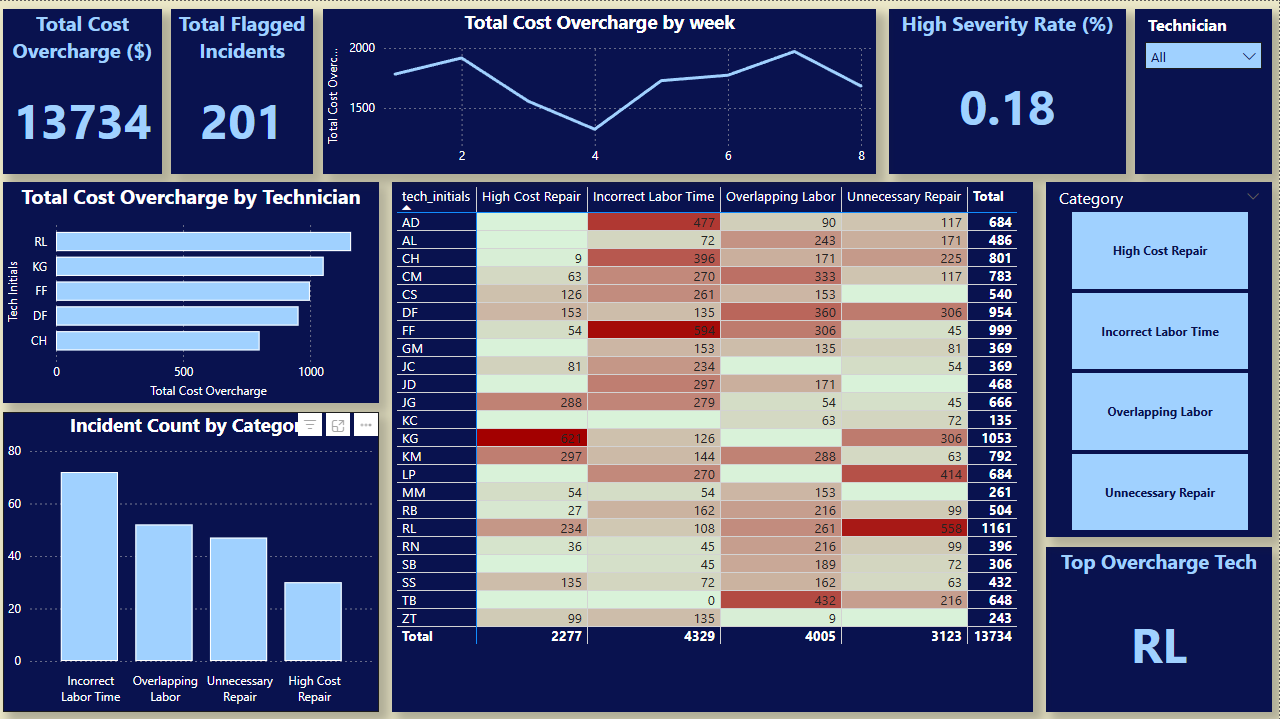
I'm currently part of a company-wide operational analysis initiative focused on labor usage and repair consistency. In this role, I review large volumes of repair order data to identify overlapping or misapplied labor, investigate trends, and present findings to senior leadership as part of a cost-reduction and process-clarity effort. This work sits at the intersection of technical judgment, attention to detail, and structured analysis.

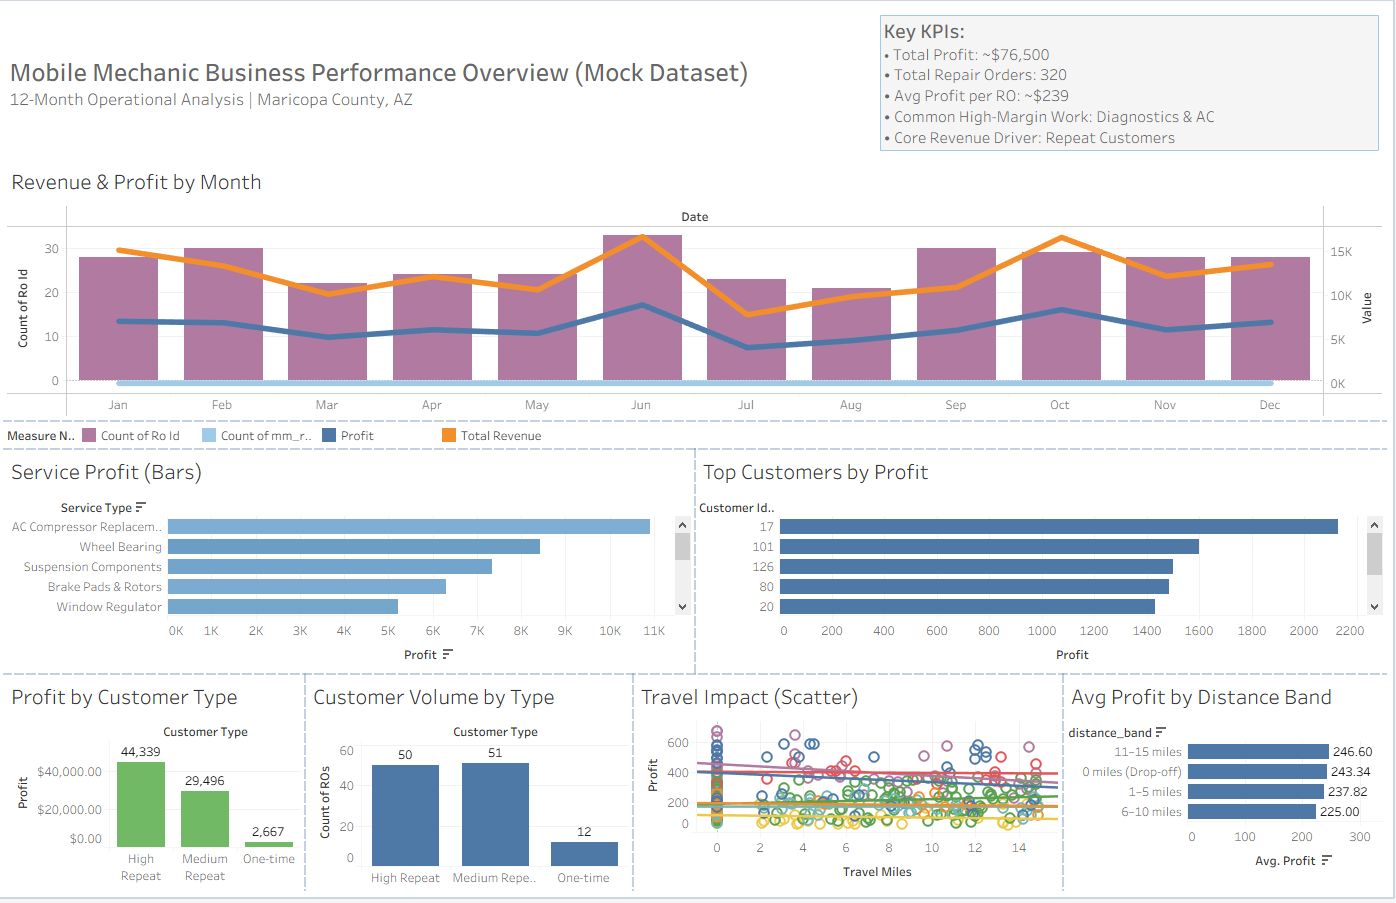
Over the past several years, I've expanded my analytical toolkit to support this work, using Excel, SQL, Python, and BI tools to explore data, build dashboards, and translate operational complexity into clear, actionable insight. I use technology as a decision-support layer, not as an end in itself, grounded in practical service and operations experience.

I'm most effective in behind-the-scenes, collaborative roles where analytical thinking, technical understanding, and clear communication help organizations make better operational decisions. Connect with me on LinkedIn if you'd like to talk.

Root cause & trend analysisLabor line & cost analysisOperations & workflow optimizationSQL, Excel & relational dataDashboards & reporting (Power BI)Prototyping internal tools (React)Cross-functional communicationTechnical documentation & clarity

Analytics & Coding Activity

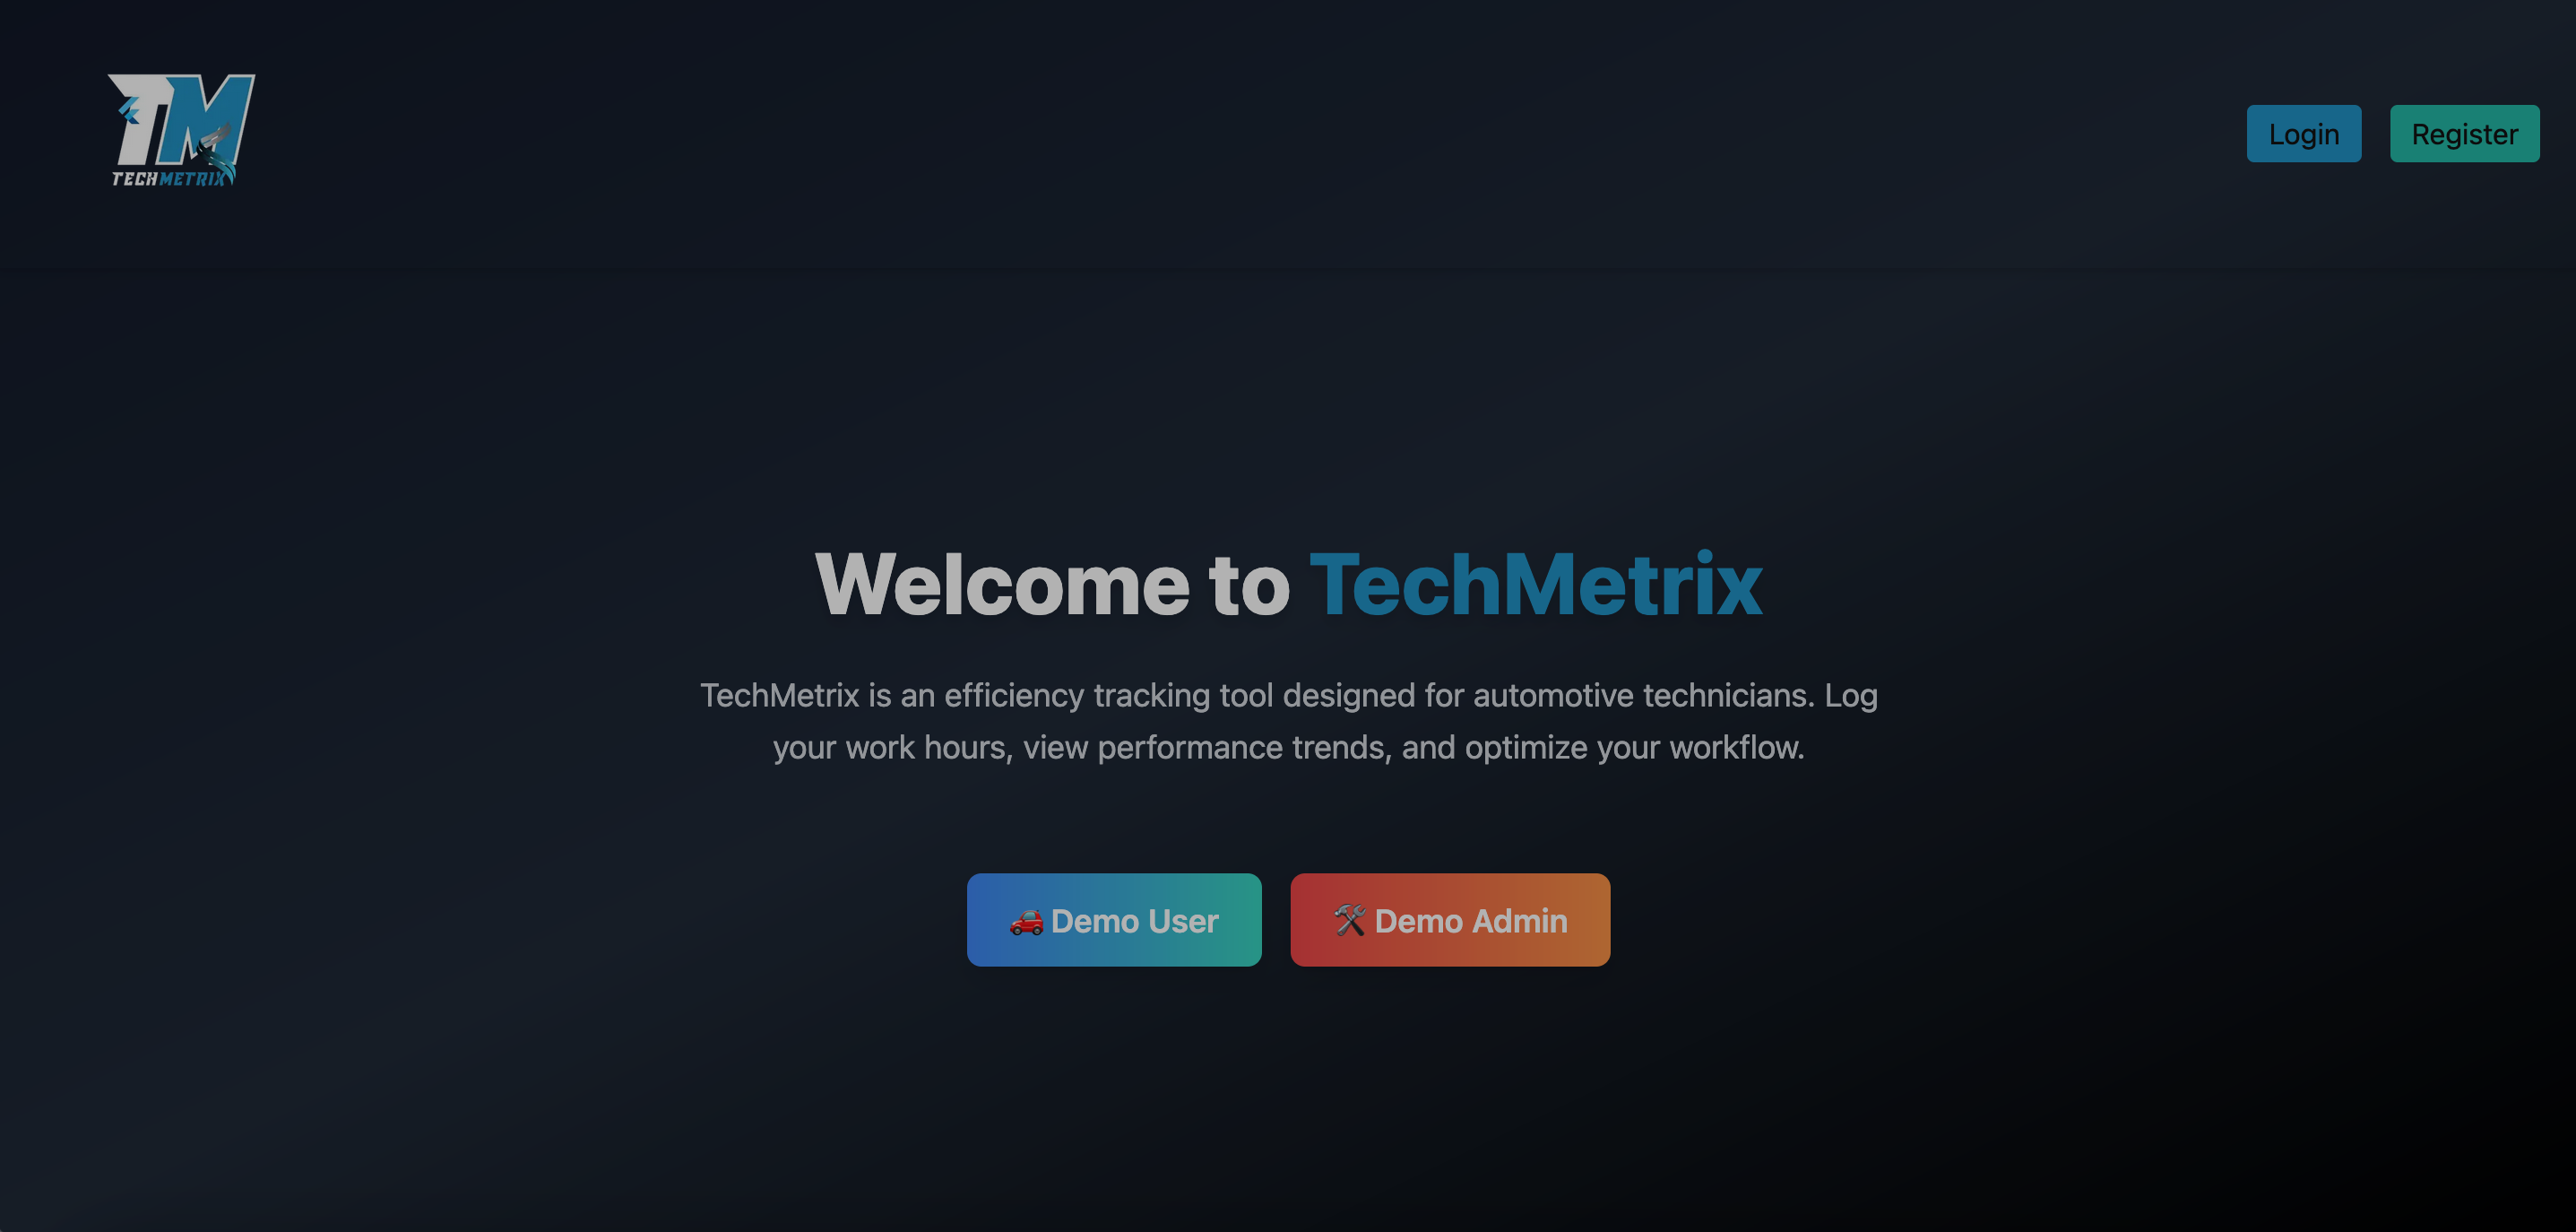
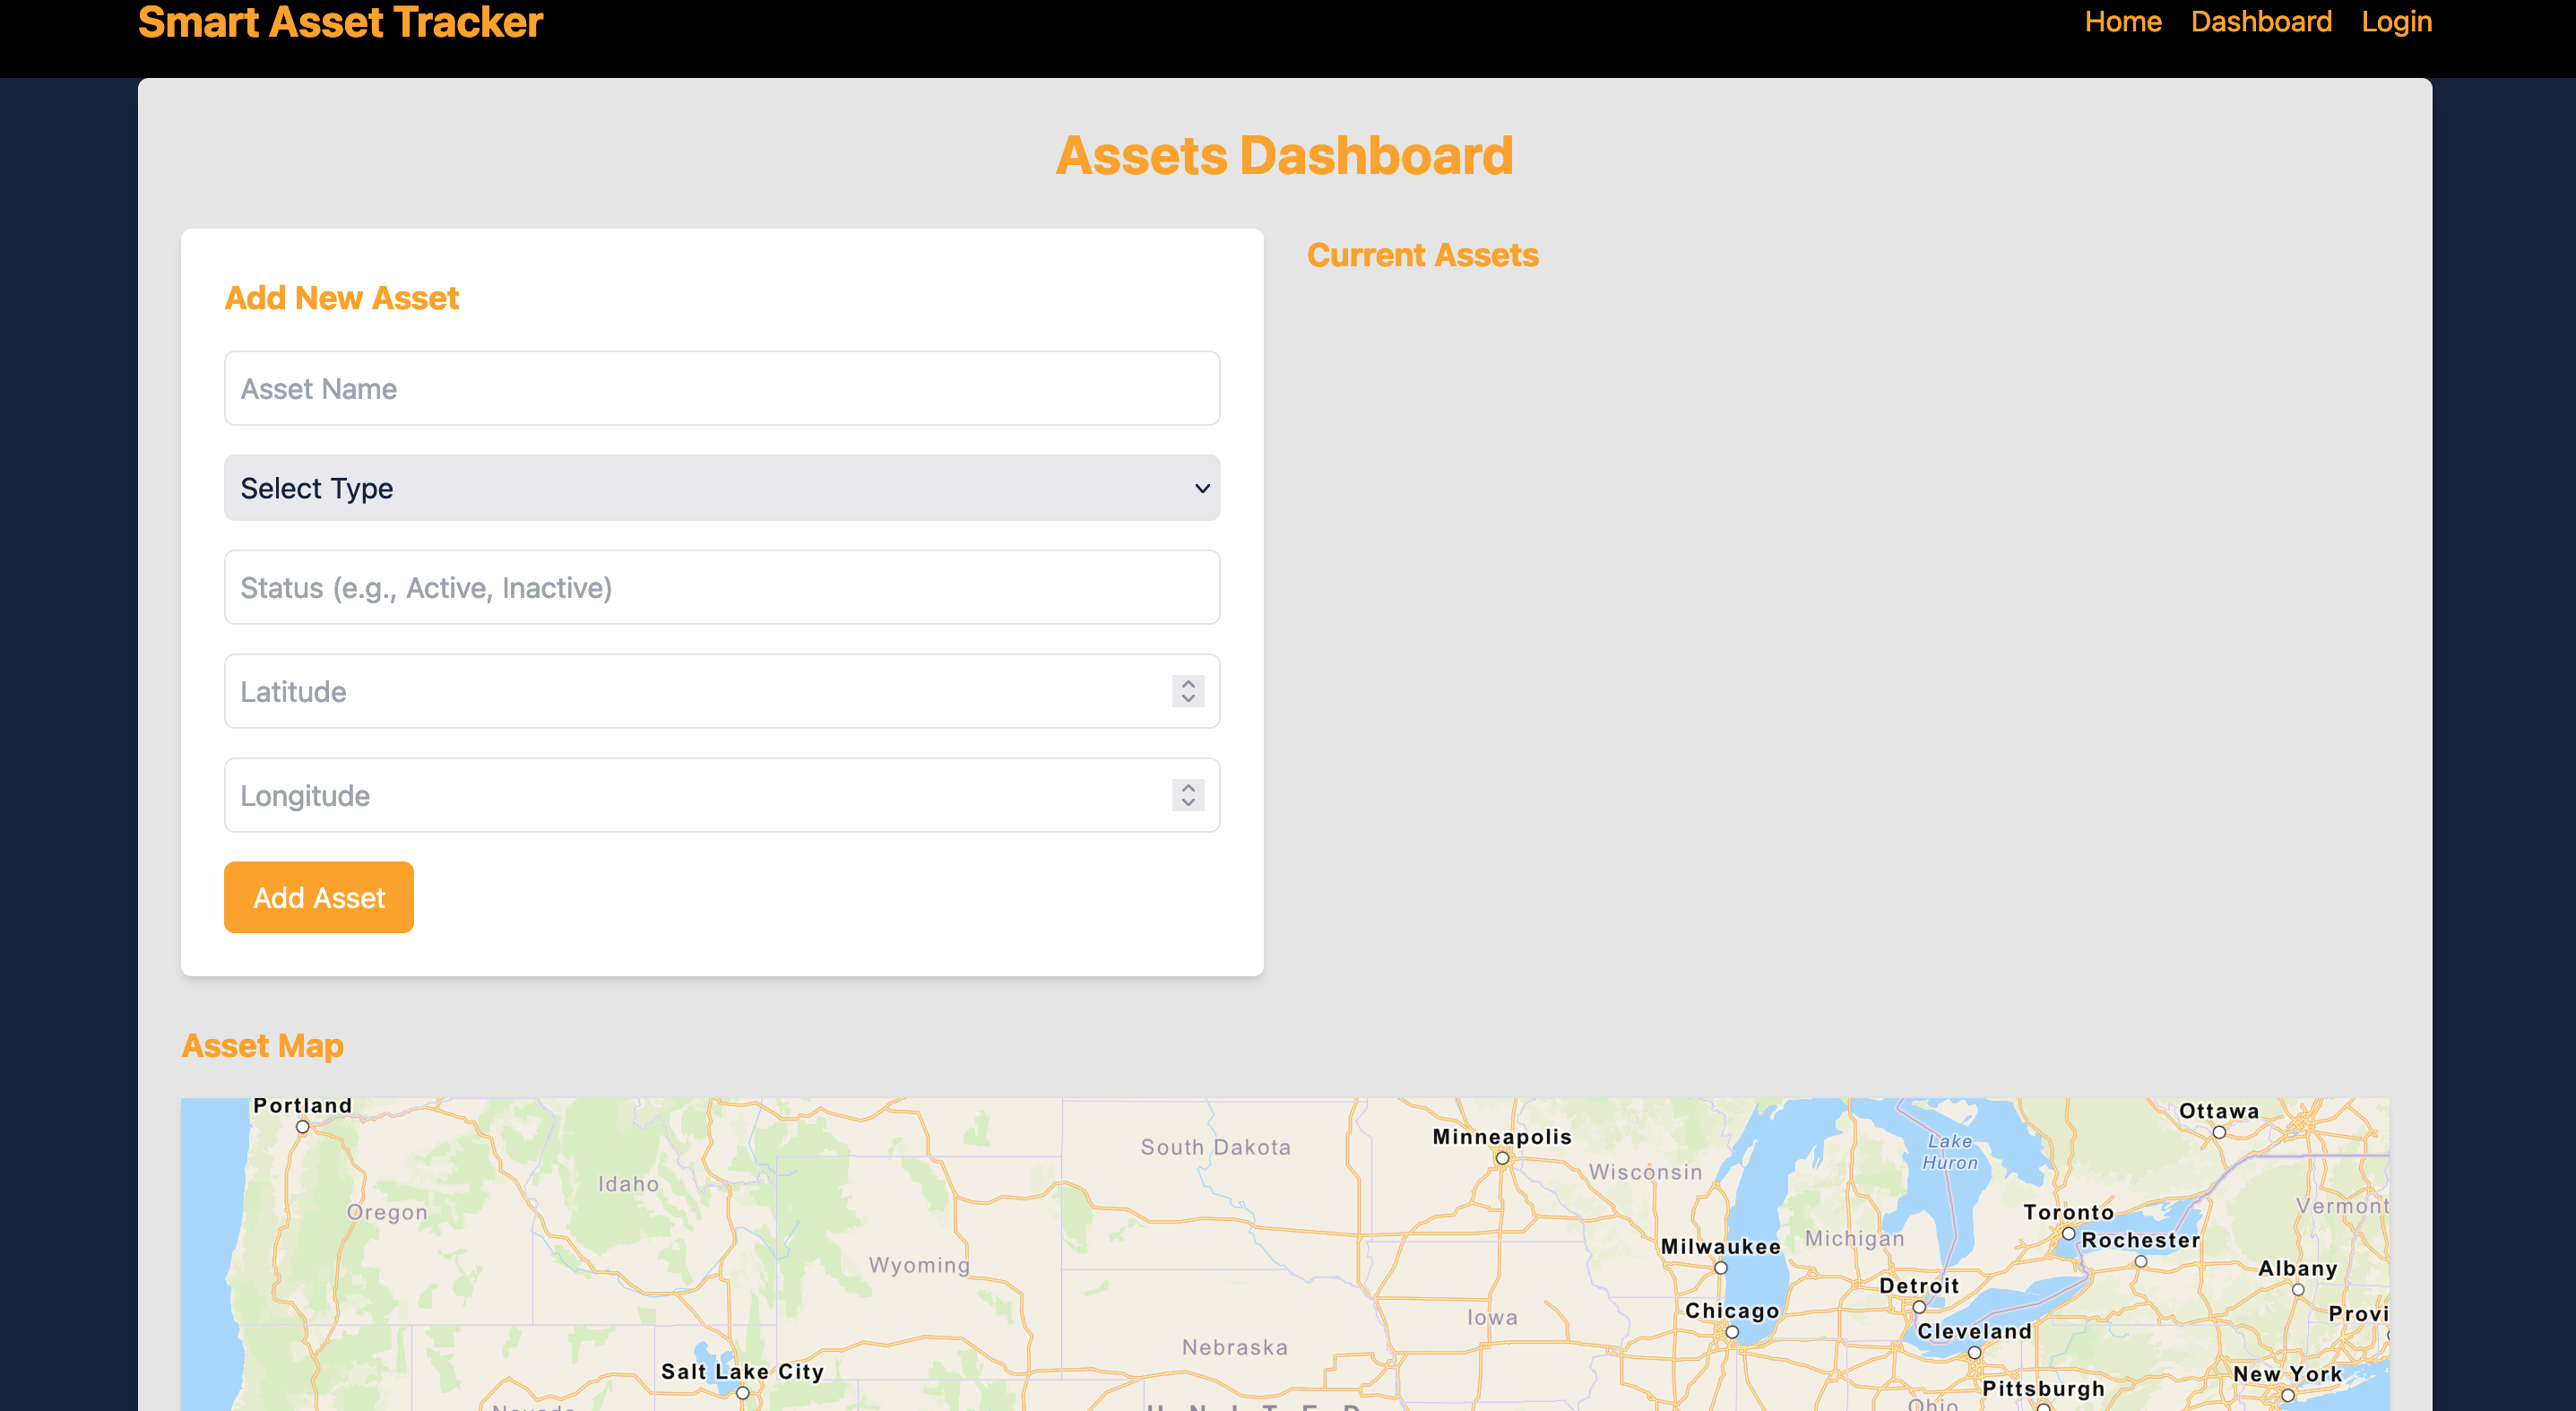
I regularly use modern analytics and development tools to build prototypes, dashboards, and automations that support analysis and decision making. Here's a snapshot of my recent GitHub activity:

JulAugSepOctNovDec

Experience

I bring 20+ years of hands-on diagnostics, technician leadership, and operational decision-making, and now apply that background to data-driven analysis, cost control, and process improvement.

Technician Production Manager & Operational Analyst (Stretch)

CarMax — Service Operations & Reconditioning

Lead technicians in a high-volume reconditioning environment while auditing repair orders, analyzing labor usage, and supporting leadership with clear, actionable insights.

  • • Review repair orders to identify overlapping, misapplied, or incorrect labor lines and flag potential cost overcharges.
  • • Analyze trends in labor usage, technician patterns, and high-severity issues to support cost-reduction and process-clarity initiatives.
  • • Use Excel, SQL-style thinking, and dashboard views to surface KPIs such as total overcharge, issue severity, and technician-level risk.
  • • Partner with leaders and advisors to translate findings into coaching conversations, clearer policies, and operational changes.

Technical & Analytics Projects

SQL • Excel • Python • Power BI • React / Next.js

Build internal-style tools, dashboards, and analysis projects that mirror real operational problems in labor usage, technician efficiency, and asset tracking.

  • • Designed an operational labor overcharge analysis project using Excel, SQL (PostgreSQL), Python (Pandas), and Power BI to simulate the stretch work I perform at CarMax.
  • • Created dashboards and prototypes such as TechMetrix, Labor Tracker, and Smart Asset Tracker to visualize performance, workload, and resource movement.
  • • Practice end-to-end analytics workflows: data cleaning, feature engineering, KPI definition, exploratory analysis, and visual storytelling.
  • • Document projects in GitHub with clear READMEs, repository structure, and business-focused summaries for hiring managers.

Analytics & Operations Projects

Selected work where I combine my diagnostic mindset with modern analytics tools to analyze systems, track operations, and support better decisions. These projects reflect how I think about data, workflows, and real-world constraints—not just how I write code.

Operational Labor Overcharge Analysis

Operational Labor Overcharge Analysis

An end-to-end analytics project using mock repair-order data to identify labor overcharges, overlapping labor, and operational risk. Built with Excel, SQL, Python, and Power BI to mirror the cost-reduction and labor-line auditing work I do in my stretch analyst role.

postgresqlPostgreSQLpythonPythongithubGitHubgitGit
Mobile Mechanic Operations Performance Analysis

Mobile Mechanic Operations Performance Analysis

An end-to-end operations analytics project analyzing profitability, service mix, customer retention, and mobile travel cost impact for a single-technician mobile mechanic business. Built with SQL, Python, and Tableau to simulate real-world small business operations analysis.

postgresqlPostgreSQLpythonPythontableauTableaugithubGitHubgitGit
AutoMate

AutoMate

A vehicle maintenance and repair-tracking system that consolidates service history, upcoming work, and predictive reminders. Designed to give users a clear view of what has been done, what is due next, and how maintenance decisions impact long-term reliability.

reactReactnextdotjsNext.jstypescriptTypeScripttailwindcssTailwindpostgresqlPostgreSQLnodedotjsNode.jsvercelVercelgithubGitHubgitGit
TechMetrix

TechMetrix

An efficiency dashboard concept for automotive teams. It aggregates repair order data to track workload, billed hours, and team performance over time, helping leaders see patterns in throughput, efficiency, and where bottlenecks or rework might be driving extra cost or delay.

reactReactnextdotjsNext.jstypescriptTypeScripttailwindcssTailwindprismaPrismapostgresqlPostgreSQLnodedotjsNode.jsvercelVercelgithubGitHubgitGit
Labor Tracker

Labor Tracker

A commission and repair-order tracker built for technicians. It allows logging jobs, tracking hours and flagged labor, and reviewing weekly totals. This grew out of a need to understand where time was really going in a pay period and how different job mixes impacted efficiency and payout.

html5HTML5netlifyNetlifygithubGitHubgitGitjestJest
T.R.E.D.

T.R.E.D.

A tire replacement evaluation tool that encodes company tire-size guidelines into a quick, technician-friendly check. It compares proposed tire sizes against approved spec ranges, reducing fitment errors and policy violations by turning a mental rulebook into a simple decision-support tool.

html5HTML5netlifyNetlifygithubGitHubgitGit
Smart Asset Tracker

Smart Asset Tracker

A prototype for tracking company assets, their status, and their locations. It combines a structured asset registry with mapping to visualize where equipment is, what condition it is in, and how it moves over time—supporting audits, loss prevention, and lifecycle planning.

reactReactnextdotjsNext.jstypescriptTypeScripttailwindcssTailwindprismaPrismapostgresqlPostgreSQLexpressExpressnodedotjsNode.jsgithubGitHubgitGit
VerifAI

VerifAI

An AI-assisted verification tool that analyzes text and images to estimate the likelihood of AI generation or manipulation. It is positioned as a risk and authenticity check—normalizing unstructured content into a simple signal that can support moderation, quality, or due diligence workflows.

reactReactnextdotjsNext.jstypescriptTypeScripttailwindcssTailwindpostgresqlPostgreSQLnodedotjsNode.jsvercelVercelgithubGitHubgitGitfirebaseFirebase

Case Studies

Deeper dives into projects where I worked through the full analytics lifecycle: defining the problem, structuring the data, analyzing root causes, and presenting findings in a way that supports real operational decisions.

Operational Labor Overcharge Analysis

Data & Operations Analyst (Portfolio Case Study)

Modeled after 2025 stretch assignment work

Context

End-to-end analytics project simulating my real stretch-role work at CarMax. Uses mock data to mirror how labor overcharges, overlapping labor, and operational inefficiencies show up in automotive reconditioning workflows.

Problem

Leaders needed a clearer picture of where labor overcharges and misapplied operations were occurring, which technicians and categories were driving cost risk, and whether issues were isolated mistakes or systemic patterns.

Approach

  • Cleaned and modeled repair order issue data in Excel, adding calculated fields for billed vs. correct labor, cost overcharge, and severity scoring.
  • Loaded data into PostgreSQL and built a reusable view with derived fields for action quality, severity score, and operational risk buckets.
  • Used SQL (including window functions) to analyze weekly trends, category rollups, technician-level variance, and high-risk operation groups.
  • Performed exploratory data analysis in Python (Pandas) to quantify distributions, outliers, and technician performance indices.
  • Built a Power BI dashboard with KPIs, technician and category breakdowns, trend lines, and slicers for severity, week, and operation group.

Outcomes & Insights

  • Identified that incorrect labor time and overlapping labor were the primary drivers of total cost overcharge in the dataset.
  • Surfaced a small subset of technicians and operation groups that contributed a disproportionate share of high-severity overcharges.
  • Demonstrated how a severity-weighted risk score can prioritize coaching and process review instead of treating all issues equally.
  • Produced an interactive dashboard that supports “where should we look first?” conversations for leaders and production managers.
  • Showcased my full-stack analytics workflow: Excel → SQL → Python → Power BI, tied to a real operational domain.

Tools & Techniques

Excel (data cleaning & calculated fields)PostgreSQL & SQL (views, window functions, KPIs)Python (Pandas, EDA, visualizations)Power BI (interactive dashboard)Git & GitHub (version control, documentation)

Mobile Mechanic Operations Performance Analysis

Business & Operations Data Analyst (Portfolio Case Study)

Modeled on 12 months of mobile repair operations

Context

End-to-end business analytics project simulating the real-world performance of a single-technician mobile mechanic operating in Maricopa County, AZ. Built using mock data to reflect pricing strategy, service mix, customer retention, and the operational impact of mobile travel.

Problem

The business needed clear visibility into which services were most profitable, how repeat customers impacted revenue, whether mobile travel distance reduced profit margins, and how monthly demand patterns affected business stability.

Approach

  • Modeled a full 12-month dataset (320 repair orders) including labor hours, labor revenue, parts cost, parts markup, travel distance, travel cost, and total profit.
  • Loaded and analyzed the data in PostgreSQL, writing KPI-driven SQL queries to evaluate service profitability, customer lifetime value, monthly trends, and mobile efficiency.
  • Used Python (Pandas) for exploratory data analysis to validate distributions, profit margin variability, travel vs profit relationships, and revenue consistency.
  • Designed a Tableau executive dashboard featuring KPI cards, monthly revenue & profit trends, top services by profit, customer retention breakdowns, and travel efficiency visualizations.
  • Structured the project using a professional multi-tool analytics workflow: CSV → SQL → Python → Tableau.

Outcomes & Insights

  • Identified diagnostics and A/C compressor replacement as the highest-margin services in the business.
  • Confirmed that repeat customers generated the majority of total revenue and profit.
  • Found that long-distance jobs (11–15 miles) produced higher average profit due to larger repair scope, while mid-range travel (6–10 miles) showed weaker margin efficiency.
  • Determined that premium vehicle brands did not consistently outperform standard brands in average profitability.
  • Produced an executive-ready interactive Tableau dashboard that supports pricing, service focus, and retention strategy decisions.

Tools & Techniques

PostgreSQL & SQL (KPI design, aggregations, business logic)Python (Pandas, EDA, validation)Tableau (interactive executive dashboard)Git & GitHub (version control, documentation)

Let's Connect

If you're hiring for Data, Operational, or Business Analyst roles or you're interested in the kind of internal tools and dashboards I build, feel free to reach out. You can use the form below or contact me directly by email or LinkedIn.